Free Project Management Software With Gantt Chart: Quick Answer
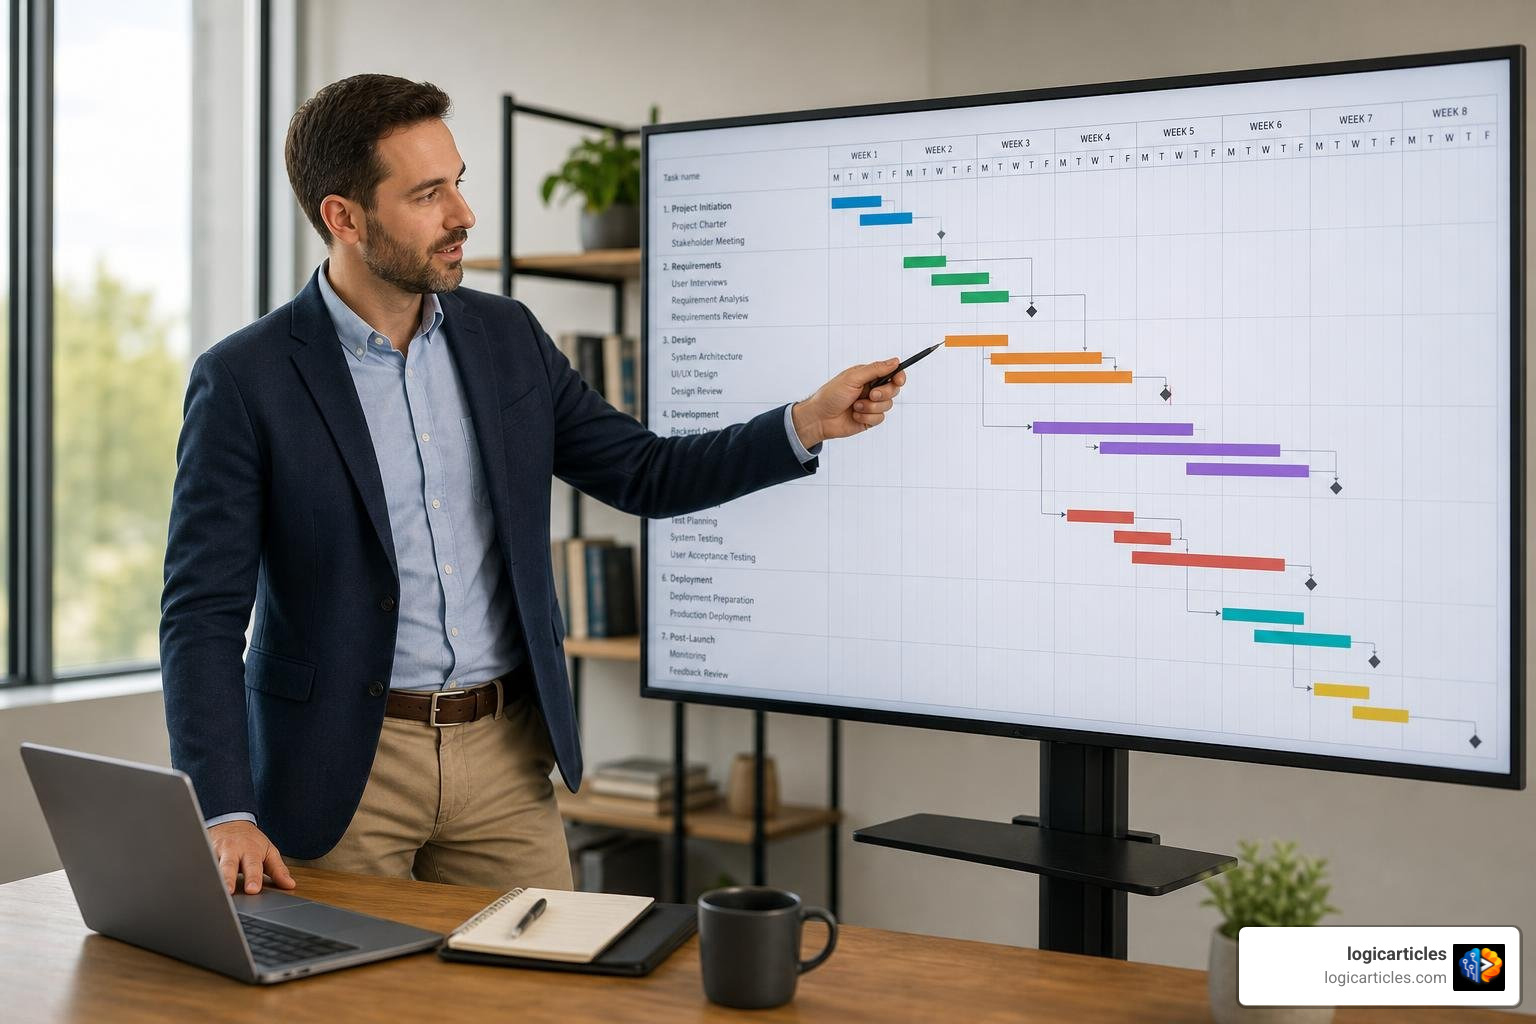
Free project management software with gantt chart features can help you map tasks, deadlines, milestones, and dependencies without paying for a subscription.
The best option depends on how you work:
- For offline, open-source planning: GanttProject and ProjectLibre offer desktop-based Gantt scheduling.
- For small teams that need online collaboration: Look for a free-forever plan with task dependencies, sharing, and enough user seats.
- For developers building a custom tool: Open-source Gantt libraries can add interactive timelines to a web app.
- For a one-off plan: Excel or Google Sheets can create a basic Gantt chart for free, but schedule changes require more manual work.
A Gantt chart turns a task list into a timeline. It shows what needs to happen, when it should happen, and which tasks must finish before others can begin. The catch: many free plans limit projects, users, storage, automations, or advanced scheduling features such as critical path analysis.
This guide compares genuinely free tools, open-source options, and free trials so you can choose a practical fit before building your project plan.
Core Features to Look for in Free Project Management Software with Gantt Chart
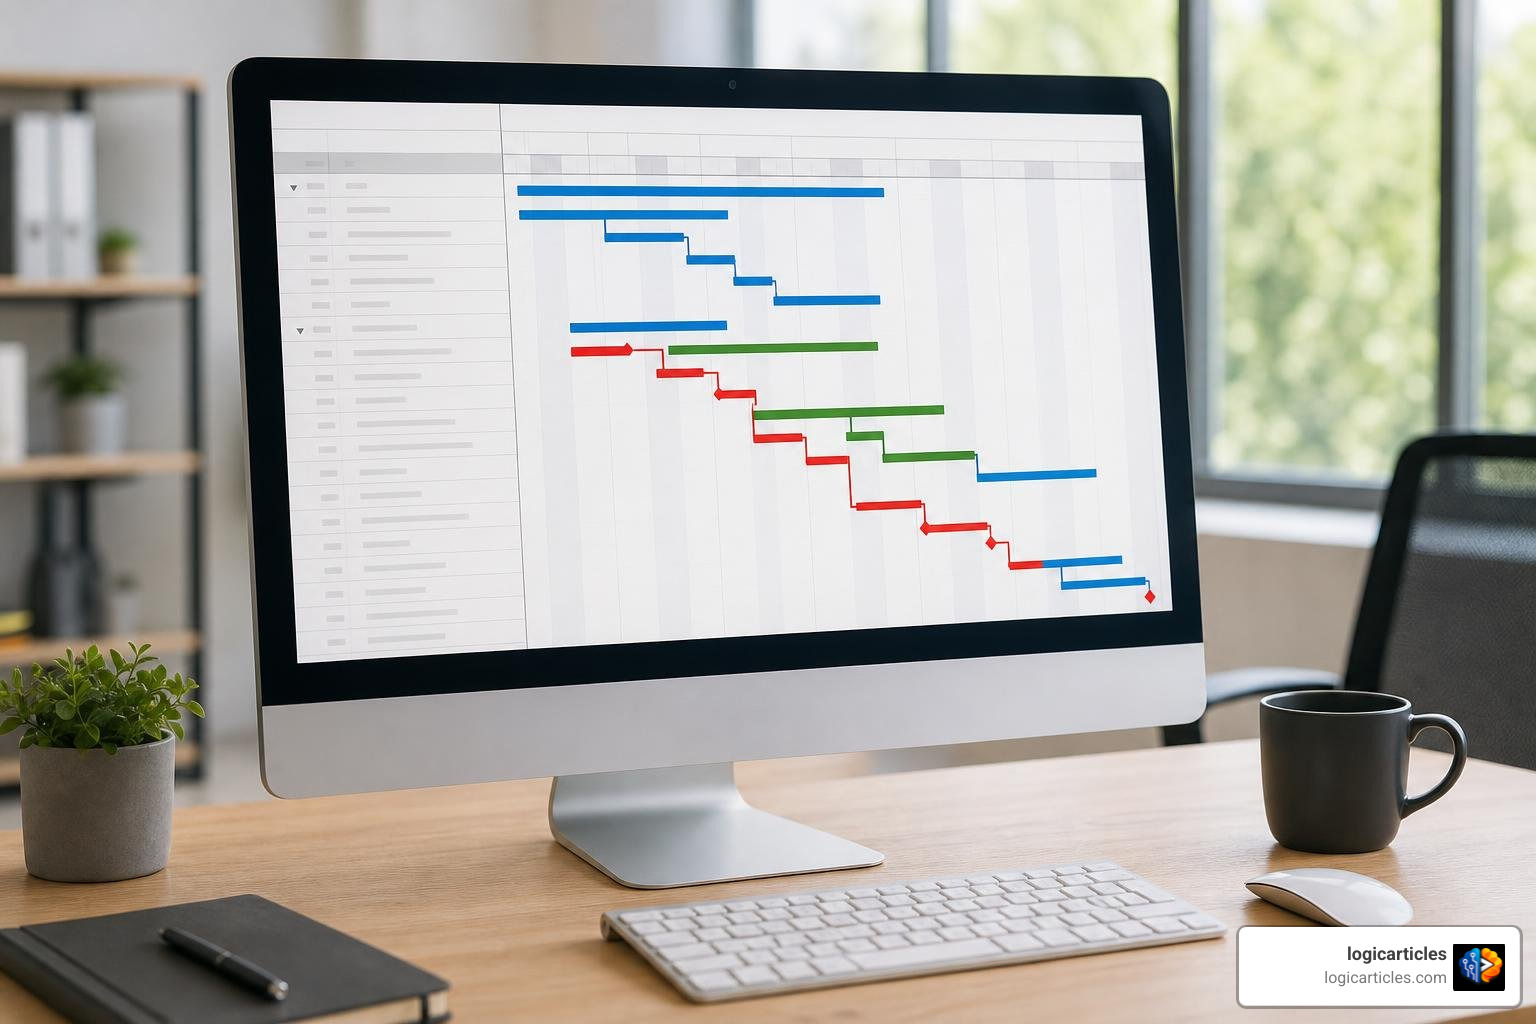
When we set out to evaluate free project management software with gantt chart capabilities, it becomes quickly apparent that not all free tiers are created equal. Some software solutions offer a static visual timeline, while others provide full-fledged interactive schedules that automatically update dependent tasks when dates shift.
To ensure you choose a platform that actually lightens your administrative workload rather than creating extra headaches, you should look for several core functional pillars:
- Interactive Drag-and-Drop Timelines: A quality Gantt chart allows you to extend task bars, adjust start and end dates, and re-order priorities directly on the visual grid.
- Milestone Identification: Milestones mark significant achievements or phase completions (like “Design Approved” or “Beta Launch”) without consuming resource hours.
- Critical Path Method (CPM): The critical path calculates the longest sequence of dependent tasks, revealing the absolute shortest timeframe in which your project can be completed. Spotting this path helps you prioritize bottleneck tasks immediately.
- Baseline Tracking: Setting a baseline saves a snapshot of your original schedule, allowing you to compare your actual progress against initial estimates as execution unfolds.
- Resource Allocation and Workload Balancing: A Gantt timeline shouldn’t exist in a vacuum; seeing who is assigned to each task prevents team burnout and helps balance workloads across projects.
Dependency Tracking in Free Project Management Software with Gantt Chart
At its core, a Gantt chart’s true magic lies in task dependency tracking. In complex projects across construction, web development, engineering, or event planning, tasks rarely happen in isolation. You can’t paint walls before the drywall is hung, and you shouldn’t launch marketing campaigns before the product build passes quality testing.
Standard Gantt software supports four classic dependency relationships:
- Finish-to-Start (FS): Task B cannot start until Task A finishes. This is the most common relationship in project management.
- Start-to-Start (SS): Task B cannot start until Task A starts.
- Finish-to-Finish (FF): Task B cannot finish until Task A finishes.
- Start-to-Finish (SF): Task B cannot finish until Task A starts (rare, but useful for shift handoffs).
Modern platforms also incorporate lead and lag time parameters. Lead time allows dependent tasks to overlap (for instance, starting documentation two days before coding finishes), while lag time enforces a mandatory delay (such as letting concrete cure for three days before building on top of it).
When auto-scheduling is enabled, shifting a single delayed task automatically cascades across all downstream dependencies. This eliminates the tedious process of updating dozens of start dates manually whenever a single deliverable slips.
Team Capacity and Mobile Access in Free Project Management Software with Gantt Chart
A project plan is only as good as the team behind it. Even on a free tier, tracking team workload balance is vital. Over-allocating a single developer or designer across five concurrent tasks inevitably causes delivery bottlenecks. Look for tools that provide dynamic resource views alongside the timeline.
Mobile accessibility is another critical factor. While reviewing a dense 200-task Gantt chart on a 6-inch mobile screen can be challenging, having cloud access on iOS and Android devices allows field workers, remote personnel, and executives to check deadlines, log hours, update task statuses, and inspect progress on the go.
Furthermore, platforms that support read-only “Spectator Links” or guest permissions allow you to share live schedule progress with external stakeholders, clients, or investors without forcing them to register accounts or forcing you to pay for extra license seats.
Comparing Open-Source and Cloud Options

When selecting project management tools, teams generally face a major architectural choice: adopt a cloud-hosted Software-as-a-Service (SaaS) platform, download an offline-first desktop solution, or build a custom dashboard using open-source developer components.
Cloud options excel at real-time collaboration and effortless setup, but their free tiers often come with artificial caps on user seats, project numbers, or total items. Local desktop and open-source solutions, by contrast, offer total data privacy, offline functionality, and no arbitrary usage caps, though they may require manual backup processes or custom server hosting.
Desktop and Open-Source Gantt Solutions
For teams seeking complete data ownership without monthly subscription fees, desktop-based open-source platforms remain powerful powerhouses.
- GanttProject: Originally born in 2003, GanttProject is a local-first, offline-capable desktop application distributed under the GNU General Public License (GPL3). It runs seamlessly across Windows, macOS, and Linux. What makes it remarkable is its longevity and commitment to software stability—current builds can open project files created over two decades ago. With a few thousand weekly downloads across nearly 200 countries, it offers full task hierarchies, resource load charts, task cost calculations, PERT chart generation, and clean exports to PDF, PNG, CSV, and MS Project formats. If you want to dive deeper into the code or contribute to its active development, you can explore the bardsoftware/ganttproject GitHub Repository.
- ProjectLibre: Serving as a primary global desktop alternative to Microsoft Project, ProjectLibre has surpassed 8.2 million community downloads across 193 countries. It provides full compatibility with MS Project desktop files, detailed Work Breakdown Structures (WBS), resource histograms, and earned value cost accounting.
Developer Libraries and Online Software
If you are an engineering team or organization looking to build custom internal project management software or embed interactive timelines directly inside an existing web application, leveraging open-source developer libraries is an ideal path.
- SVAR React Gantt: Built natively in React with full support for React 18/19 and Next.js, open-source React Gantt libraries deliver high-performance timeline rendering under an open-source MIT license. Capable of handling over 10,000 tasks smoothly through virtualization, they include TypeScript definitions and offer support for AI-assisted development inside coding tools.
- DHTMLX Gantt (Community Edition): A widely adopted JavaScript library, the DHTMLX Gantt Community Edition provides lightweight task grids, drag-and-drop scheduling, four dependency link types, and 32 built-in localization languages under an MIT license for web developers building custom interfaces.
Free Gantt Software vs. Paid Versions and Free Trials
Understanding the financial structure of project management software saves you from unexpected paywalls mid-project. Vendors generally divide their non-paying offerings into three distinct categories:
- Free-Forever Plans: Tools that offer zero-cost access indefinitely, though typically restricted by user seat limits, storage allowances, or capped automations.
- Freemium Tools with Feature Paywalls: Platforms that let you sign up for free, but restrict key project management views (like the Gantt chart itself) or cap usages. For example, certain freemium cloud tools limit users to 60 total uses of their Gantt chart view before requiring a paid upgrade, or restrict dynamic timeline views and integrations to higher tiers.
- 14-Day to 30-Day Free Trials: Full access to enterprise-level features for a temporary period, allowing complete access to workload management, auto-scheduling, and baselines before deciding on a subscription.
Here is a side-by-side overview comparing popular free plans, trial structures, and paid upgrade triggers across major project platforms:
| Platform | Free Tier Structure | Key Free Features Included | Major Limitations / Paywall Triggers | Paid Plans Start At |
|---|---|---|---|---|
| GanttProject | Free Forever (GPL3 Open-Source) | Unlimited projects, desktop offline storage, resource assignment, CPM, PDF/MS Project export | Requires cloud add-ons for real-time web sync | Free ($0 desktop) / Cloud add-ons available |
| ProjectLibre | Free Forever (Open-Source Desktop) | Unlimited projects, MS Project file compatibility, WBS, earned value calculations | Desktop-focused; real-time cloud multi-user editing requires enterprise server | Free ($0 desktop) |
| Open-Source Web Libraries | Free Forever (MIT License) | Developer integration, high performance, customizable interactive timelines | Requires web development setup and server hosting | Free ($0 open source) |
| Freemium Cloud Tools | Free Forever Tier / Freemium | Basic task management, list & board views, limited mobile access | Seat limits (2–5 users), storage caps (100MB), usage limits on Gantt views | Billed annually from $5–$9/user/mo |
| Commercial Free Trials | 14-Day to 30-Day Free Trial | Full access to interactive Gantt charts, auto-scheduling, baselines, time tracking | Trial expires after 14–30 days; requires subscription afterward | Billed annually from $8/user/mo |
How to Build a Free Gantt Chart in Excel or Google Sheets
If your organization prohibits installing third-party applications or creating external cloud accounts, building a basic Gantt chart inside Microsoft Excel or Google Sheets is a practical workaround. While static spreadsheets lack automated cascading dependencies and critical path recalculations, they work well for simple timelines.
Here is a step-by-step walkthrough to build a functional Gantt chart in spreadsheets:
Step 1: Set Up Your Project Data Grid
Create a structured table with six essential columns:
- Column A: Task Name
- Column B: Start Date
- Column C: End Date
- Column D: Duration (Days) — Formula:
=C2-B2 - Column E: Completed (Days)
- Column F: Remaining (Days) — Formula:
=D2-E2
Step 2: Insert a Stacked Bar Chart
- Highlight your Start Date data.
- Go to Insert > Chart and select Stacked Bar Chart (Horizontal).
- In the chart data settings, add Duration as a second data series directly on top of Start Date.
Step 3: Format the Chart into a Gantt Timeline
- Click on the first series (Start Date bars) on your chart canvas.
- Set the fill color to No Fill (Transparent). This hides the initial portion of the bar, leaving the “Duration” segment floating in space aligned with your schedule dates.
- Adjust the minimum bound of the chart’s horizontal axis to match your project’s earliest start date code so the bars fill the space neatly.
Step 4: Apply Conditional Formatting (Alternative Grid View)
If you prefer a calendar-style grid directly inside cell blocks:
- List calendar dates across top column headers (e.g., Day 1 to Day 30 in Row 1).
- Highlight the calendar grid and create a Conditional Formatting Rule.
- Use a custom formula such as
=AND(G$1>=$B2, G$1<=$C2)to automatically shade cells when the header date falls between a task’s start and end dates.
Note on Spreadsheet Trade-offs: While spreadsheet Gantt charts are free and easily accessible, moving a project baseline by two weeks requires updating cell dates manually or building complex lookup formulas. Dedicated project software handles these adjustments instantly.
Frequently Asked Questions About Gantt Software
Which free Gantt chart tools are best for small vs. large teams?
For small teams (1–5 members) or individual freelancers, freemium cloud tools provide an excellent entry point. They give small groups real-time online collaboration, task commenting, and drag-and-drop Gantt views without requiring local server setup.
For larger teams or enterprise organizations, software restrictions on free plans (such as strict 2-user or 5-user caps) become immediate roadblocks. Large or cross-functional groups generally benefit more from open-source desktop platforms like GanttProject or ProjectLibre deployed across staff computers, as these tools have zero user seat restrictions. Alternatively, enterprise developers can deploy self-hosted web applications using open-source libraries like SVAR React Gantt or DHTMLX Gantt.
What are the main limitations of free Gantt chart software?
While free project tools deliver substantial utility, vendors must monetize their investments somehow. The most common constraints include:
- View and Feature Paywalls: Free plans often allow list or Kanban board views, but restrict Gantt charts, baselines, or critical path tracking to paid tiers (such as usage caps on Gantt timeline views or excluding Gantt features on basic free tiers).
- User Seat and Project Caps: Many cloud platforms cap free accounts at 2 to 5 active users or restrict accounts to 1–3 active projects.
- Item and Storage Constraints: Storage is frequently capped at 60MB to 100MB, preventing heavy file attachments. Certain tools impose item limits across the entire account.
- Automation Limits: Automated actions (such as sending email updates when a Gantt task completes) are strictly limited on free tiers—often to 100 executions per month.
What is the difference between free software and a free trial?
A free-forever plan grants access to a specific version of the software with no end date. You can use it for months or years without entering payment details, provided you operate within its defined capacity and feature limits.
A free trial (typically lasting 14 to 30 days) grants temporary unrestricted access to full enterprise features. Once the trial window expires, the platform will prompt you to enter credit card details for a paid subscription or automatically downgrade your account to a restricted free tier. Free trials are ideal for short-term evaluation before making a corporate purchasing decision, whereas free-forever software is built for ongoing, low-budget execution.
Conclusion
Choosing the right free project management software with gantt chart features ultimately comes down to your project scope, team size, and data privacy requirements:
- If you need unlimited projects, total data privacy, and full critical path analysis with zero subscription fees, open-source desktop applications like GanttProject and ProjectLibre remain unbeatable choices.
- If you manage a small online team that needs accessible task sharing without installation setup, freemium web tools deliver lightweight cloud collaboration.
- If you are an engineering team building custom software, open-source web libraries like SVAR React Gantt or DHTMLX Gantt provide complete developer control.
- If you simply need a quick, one-off timeline and already use office suites, building a stacked bar Gantt chart in Excel or Google Sheets gets the job done without signing up for new services.
By identifying whether your workflow prioritizes real-time web collaboration, offline desktop independence, or custom developer integration, you can select a tool that keeps your projects delivered on time and within budget. For more insights on optimizing team performance and discovering workflow tools, check out our resources in the LogicArticles Productivity Category.